


Summary of "Balancing Acts: Safe Withdrawal Rates in the Indian Context"

When a person retires, he withdraws a certain percentage of his portfolio the first year, and increases that amount every year with inflation. For example, if you retire with 10 crores, and your chosen withdrawal rate is 3%, then you’re going to withdraw 30 lakhs the first year, and increase that number every year with inflation to maintain your lifestyle.1
What percentage of his portfolio should a retiree withdraw every year? Too much, and he’ll go broke. Too little, and he’ll live in poverty and leave behind a lot of money. The Safe Withdrawal Rate (SWR) has been calculated based on returns from 1979 - 2022 by a prior paper as 2.6%.
This paper gives a number of 2.8% assuming you’re planning for 35 years and not 25 or 30.
A moderate equity allocation works best. Too little equity, and your returns will be low, leaving you broke, which is a guaranteed failure. Too much equity, and the chance is high than the market will go down, leaving you broke, which is a likely failure. You should balance the probabilities of these two. It’s like braking on the highway when the vehicle in front brakes — if you brake too gently, you hit the vehicle in front and if you slam on the brakes, you’ll be rear-ended. You need to balance the two risks.
Include 10% gold in your portfolio, since it reduces the chance of going broke.
In the US, the rule of thumb is 4%, referred to as SAFEMAX, but you can’t copy-paste that number for India.
Equity and fixed deposits have uncorrelated real2 returns.
The real returns from equity from Dec 1999 to Aug 2023 has been 6.54%
The BSE Sensex has been running since 1875!
Methodology
Real returns, not nominal: You can’t ignore inflation.
Expressing money in real vs nominal terms: You can model a retiree as withdrawing increasing amounts of money every year, because of inflation. In this case, you should consider nominal returns from the investment. Equivalently, you can model the retiree as withdrawing the same amount of money every year, using a virtual unit of currency called an inflation-adjusted rupee, and do your entire analysis in inflation-adjusted rupees, such as modeling real returns rather than nominal.
Post-tax returns: You can’t ignore tax.
Total, not nominal returns: You can’t ignore dividends.
Geometric mean: If you got X% return in one year and Y% the next, you should use the geometric, not arithmetic, mean to calculate an overall number. This is because of compounding.
Better data for fewer years vs worse data for more years: Sometimes you have to choose between two indices, one of which covers a longer time period but covers lesser of the market. You have to pick one, but how do you know whether the conclusions from your analysis would have been significantly different had you picked the other? To answer this question before you do your analysis, do a regression analysis and calculate the R² and β. If they’re both close to 1, that means that both datasets are similar for their overlap period. Then you can pick the dataset that spans more years for better results.
Scaling a data set: Sometimes we recalibrate a data set to make it easier to consume, while preserving its accuracy. For example, Google Trends normalises the highest point to 100:
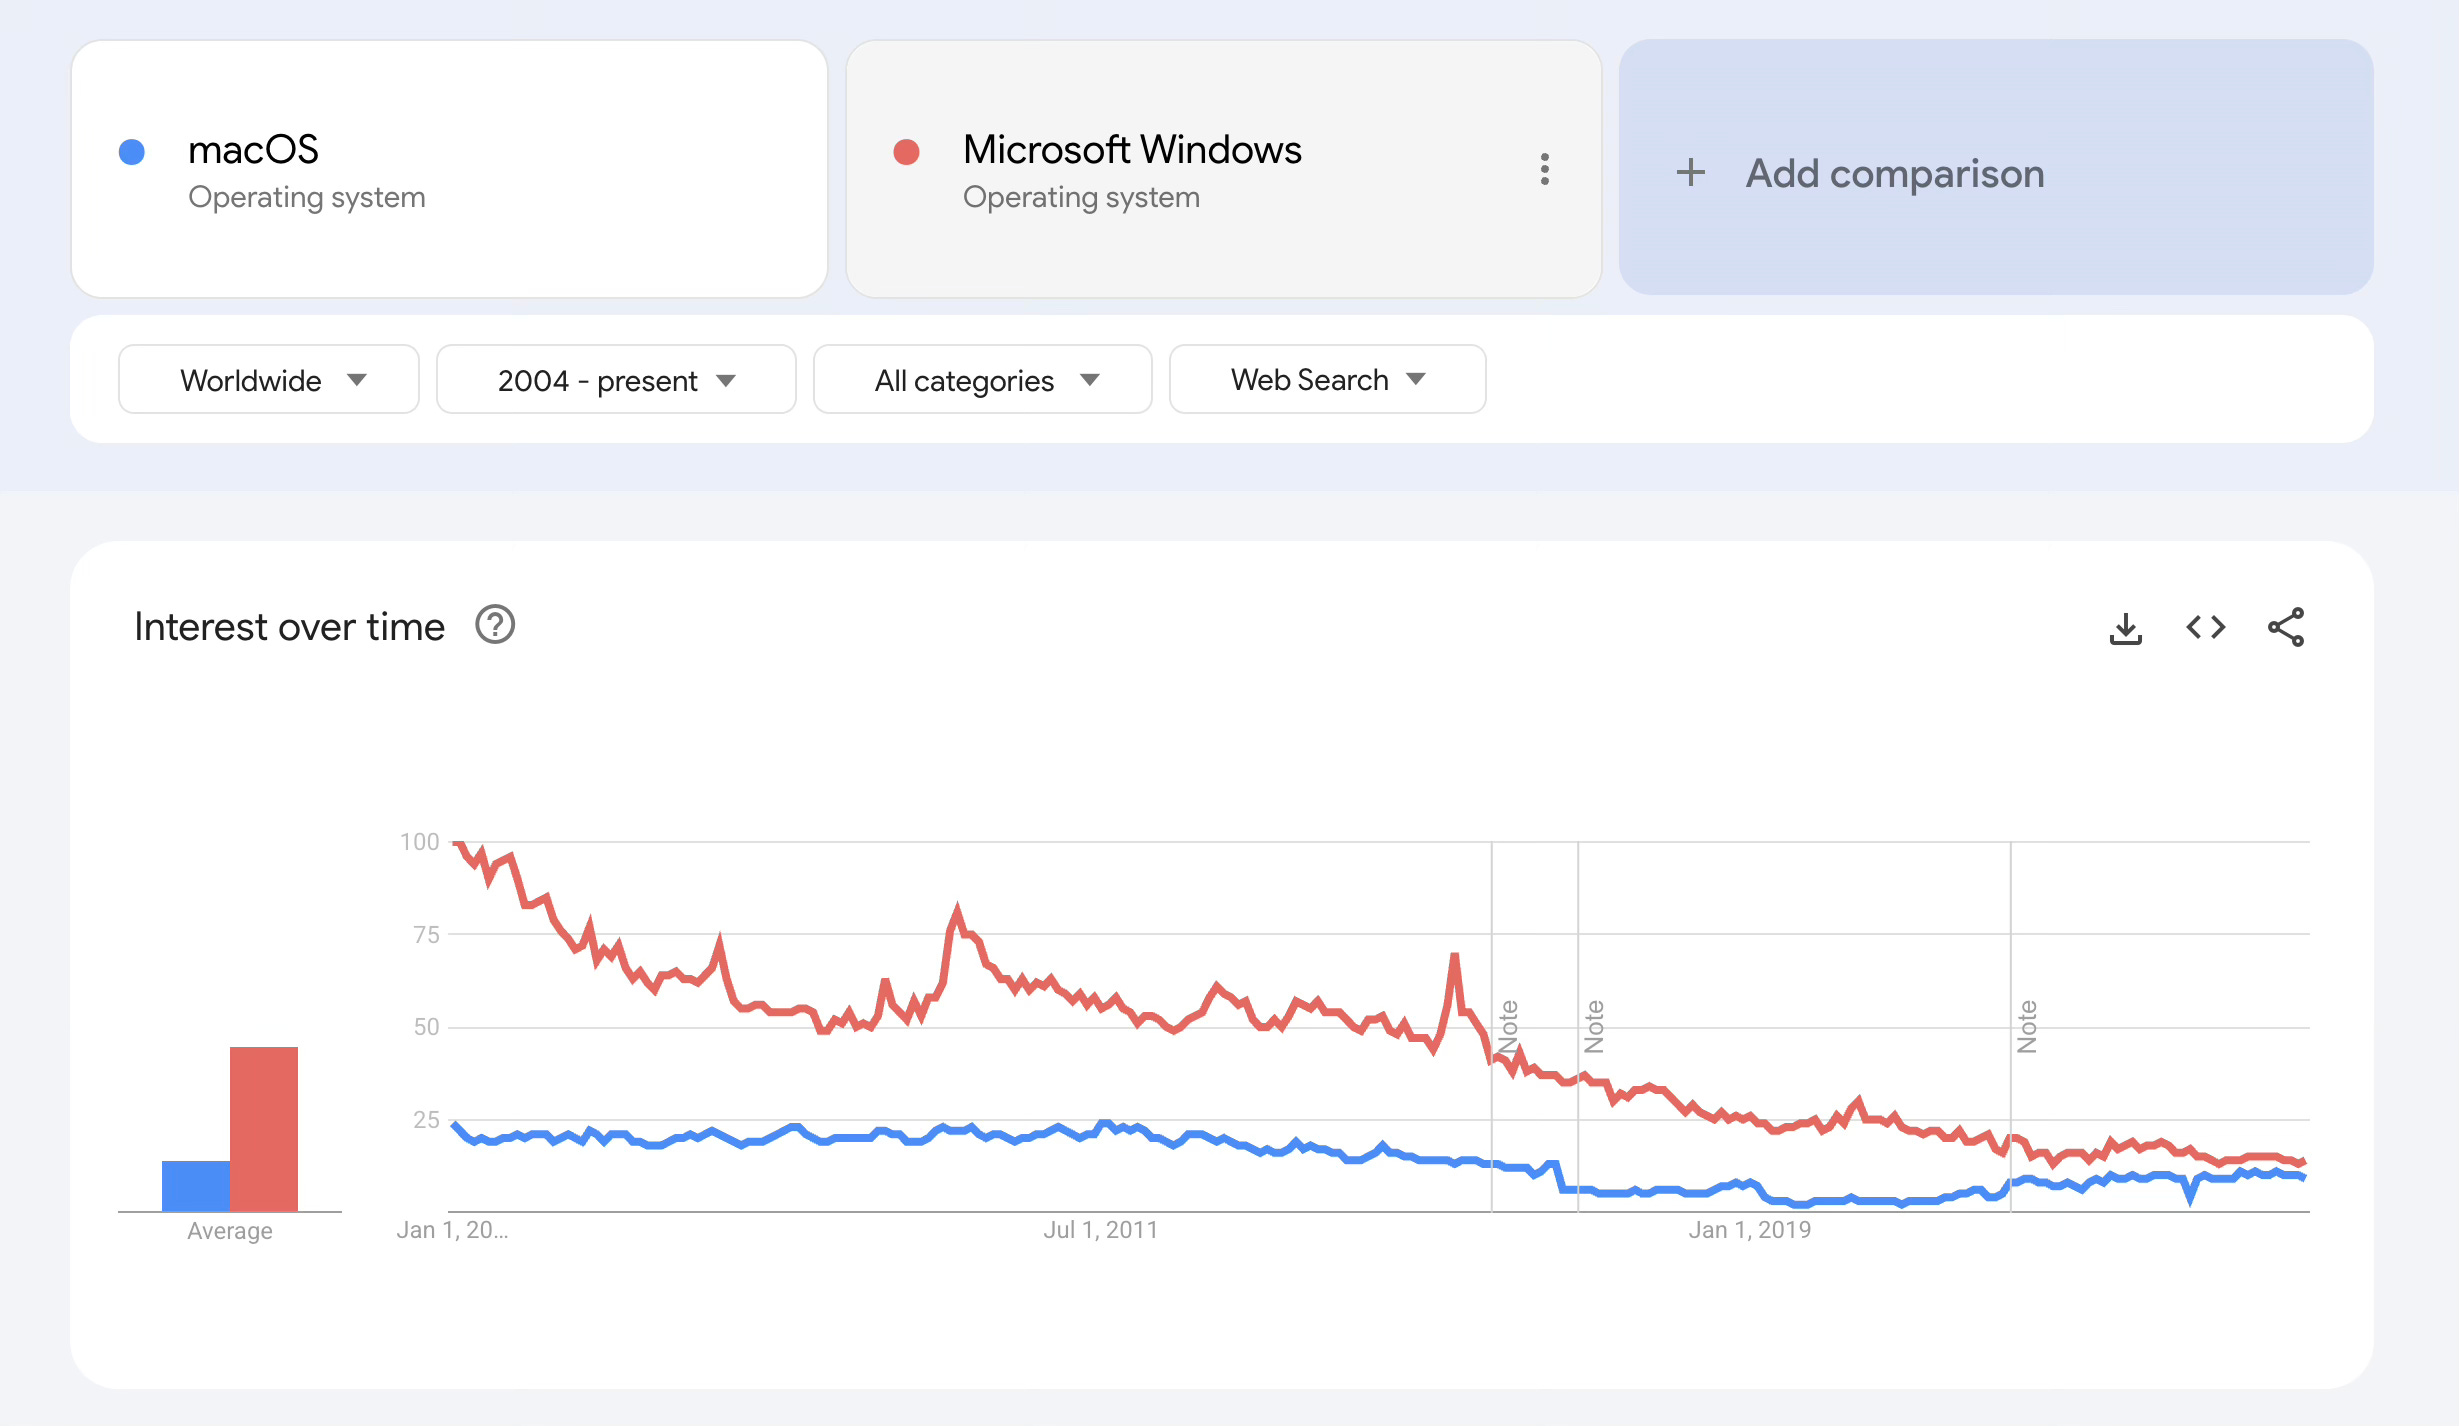
So if we see that the graph at a certain time is at 45, it means 45%. On the other hand, if the highest point weren’t normalised, and was some random value like 4539, it just adds friction.
As another example, if you want to compare two data sets of inflation, one with a value 100 in 2016 and another with value 100 in some other year, you need to normalise one to match the other.
Avoid starting month bias: Say you have data for 20 years. Don’t divide it into 20 one-year time periods, each starting on the same date like Jan 1. If returns are typically higher or lower at a certain time of the year, your analysis is biased. Instead, divide it into 20 x 12 periods, starting each month, to avoid starting point bias.
Out of sample: A model can’t be validated using the same data that was used to train it.
Circular block bootstrapping can be better than moving block: Ideally you’d have data for many centuries to make the conclusions statistically significant. However, when you have data only for a limited time period, like 2000-2023, when you consider a person who retired in 2000 and the other in 2020, the latter has only 3 years of data to model how he fares in retirement, which isn’t enough. To fix this, wrap the data around. Imagine that the second retiree, after 2023, gets the same rate of return as was obtained in 2000-2019. It’s not that the person is going back in a time machine, but that we’re assuming that from 2024 onwards, the returns will be a repetition of historical returns. This is circular. It’s in contrast to moving block, where you first choose a block size (say a decade) and then slide it around considering various time periods from 2000-2010, 2001-2011, 2002-2012 all the way to 2013-2023. Now, the year 2010 is included in 11 blocks (2000-2010, 2001-2011, 2002-2012 all the way to 2010-2020) while 2023 is included only in 1 block (2013-2023). This overweights some years and underweights others, resulting in an inaccurate conclusion. Wrapping it around fixes this problem, too.
Stationarity means that the statistical properties of a time series, like mean and variance, remain constant over time. Otherwise, you can’t forecast.
Sequence effects: Sometimes the same occurrences in a different order change the result completely. If two retirees both live for 30 years and have the same average returns for 30 years, except that A experiences terrible returns in the first decade, while B experiences great returns in the first decade, A is more likely to run out of money3.
As you withdraw money every year, you’ll be left with less, which doesn’t mean that you’re going to withdraw 3% of what remains the next year.
Inflation-adjusted.
If A runs out of money in 20 years, but experiences high returns for the subsequent 10 years, it’s too late, because he doesn’t have any money left in his corpus. A high percentage of 0 is 0.
If you have a portfolio from which you’re not withdrawing money and into which you’re not making additional investments, sequencing doesn’t matter. A 10% return followed by a 20% return is same as the other way around since 1.1 x 1.2 = 1.2 x 1.1. Multiplication is commutative.